Designing the Semy Client Dashboard
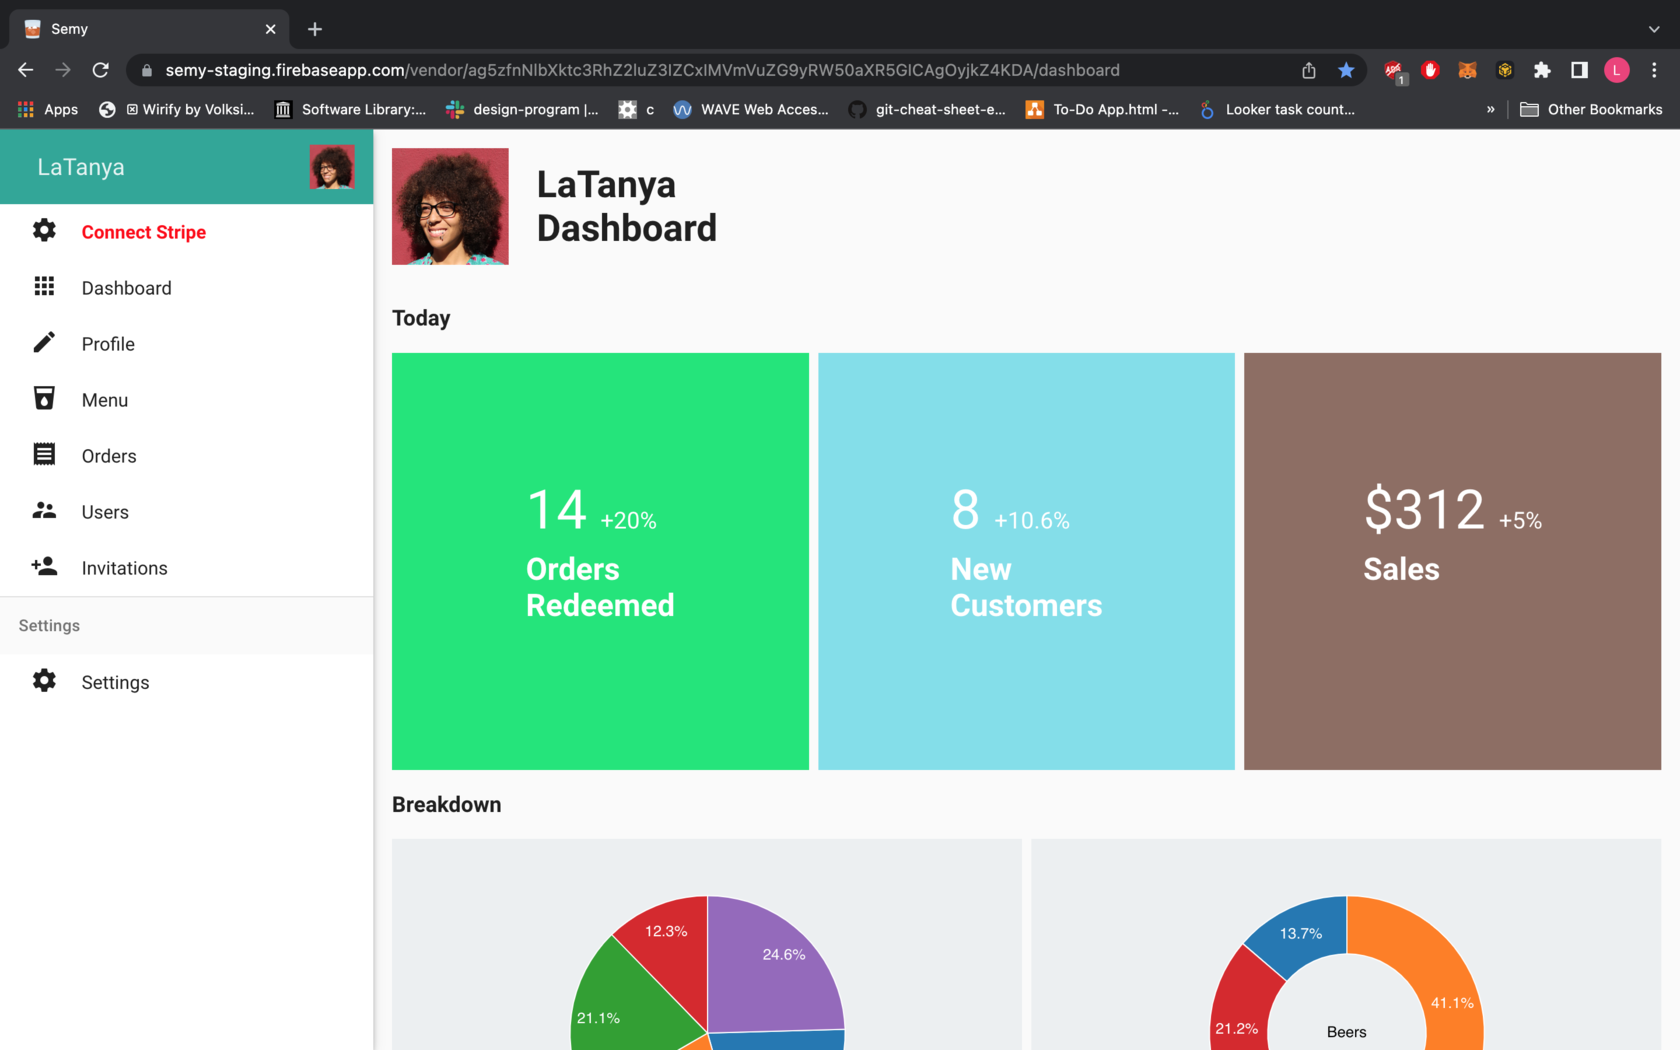
Semy is a social gifting and social ordering marketplace — send bites & brews, gym & spa services from your favorite local spots. This is the story of how its merchant-facing analytics dashboard went from an outdated, placeholder-heavy tool to a clear, data-driven product.
The Problem
The existing dashboard had fallen behind: the visual design felt dated, the screens leaned on placeholder content instead of real data, and merchants couldn't actually see the numbers that mattered to their business.
Outdated design
The interface hadn't been refreshed and no longer matched the rest of the product.
No meaningful data
Merchants couldn't see the sales, order, and customer metrics they actually needed.
Placeholder-heavy
Too many screens shipped with "lorem ipsum" and empty states instead of real content.
Designer Context
This was a solo design effort, working directly across engineering and sales rather than within a larger design team. The project took shape during the COVID-19 lockdown, when the platform's merchant base was concentrated entirely in food & beverage — restaurants and bars trying to keep a read on their business while everything else was uncertain.
Lockdown presented a couple of unique issues:
Research & Methodology
Many dashboards were reviewed across all kinds of industries, with extra attention on food & beverage. That research turned up plenty of patterns, but raised a harder question: during heavy lockdown, did merchants even have enough sales and menu data to make a meaningful dashboard worthwhile? Answering that meant talking to both the sales team and clients directly.
Competitive analysis
Dashboards across adjacent industries were reviewed to see how other products structured the same kind of data. Four recurring layout patterns emerged — reconstructed here as generic references rather than screenshots of any specific product:
Card-heavy, fintech-style
Leads with several small metric cards above one chart. Scans fast, but buries the one number that matters most.
Dense data-table style
Favors raw rows of orders and transactions over visual summaries — powerful, but a steep read for a non-technical merchant.
Chart-first analytics style
One large trend chart dominates the screen. Great for spotting patterns, weak on the day-to-day "what do I do now."
Minimal single-KPI style
Surfaces just one headline number per screen. Clean and confident, but required digging for anything beyond the headline.
The final direction borrowed from all four: card-level KPIs for a fast scan, paired with a real chart underneath for the trend — rather than committing to just one pattern.
Questionnaire
Instead of sending out surveys, clients were asked directly — a couple of open questions to spark dialogue about data:
"Do you have enough sales to show consistent data?"
Answers varied, as expected — since it wasn't yet clear what kind of data would even be shown, most said it would depend.
"Would you rather have some data shown, or none at all?"
Universally: it doesn't hurt to have it there, and be prepared for when/if the world opens back up — especially useful if they ran a marketing campaign with Semy and wanted a sense of its impact.
The data clients actually wanted came up again and again:
The conclusion from these conversations: build out a standard dashboard first, then strip away whatever turns out not to be needed.
Information Architecture
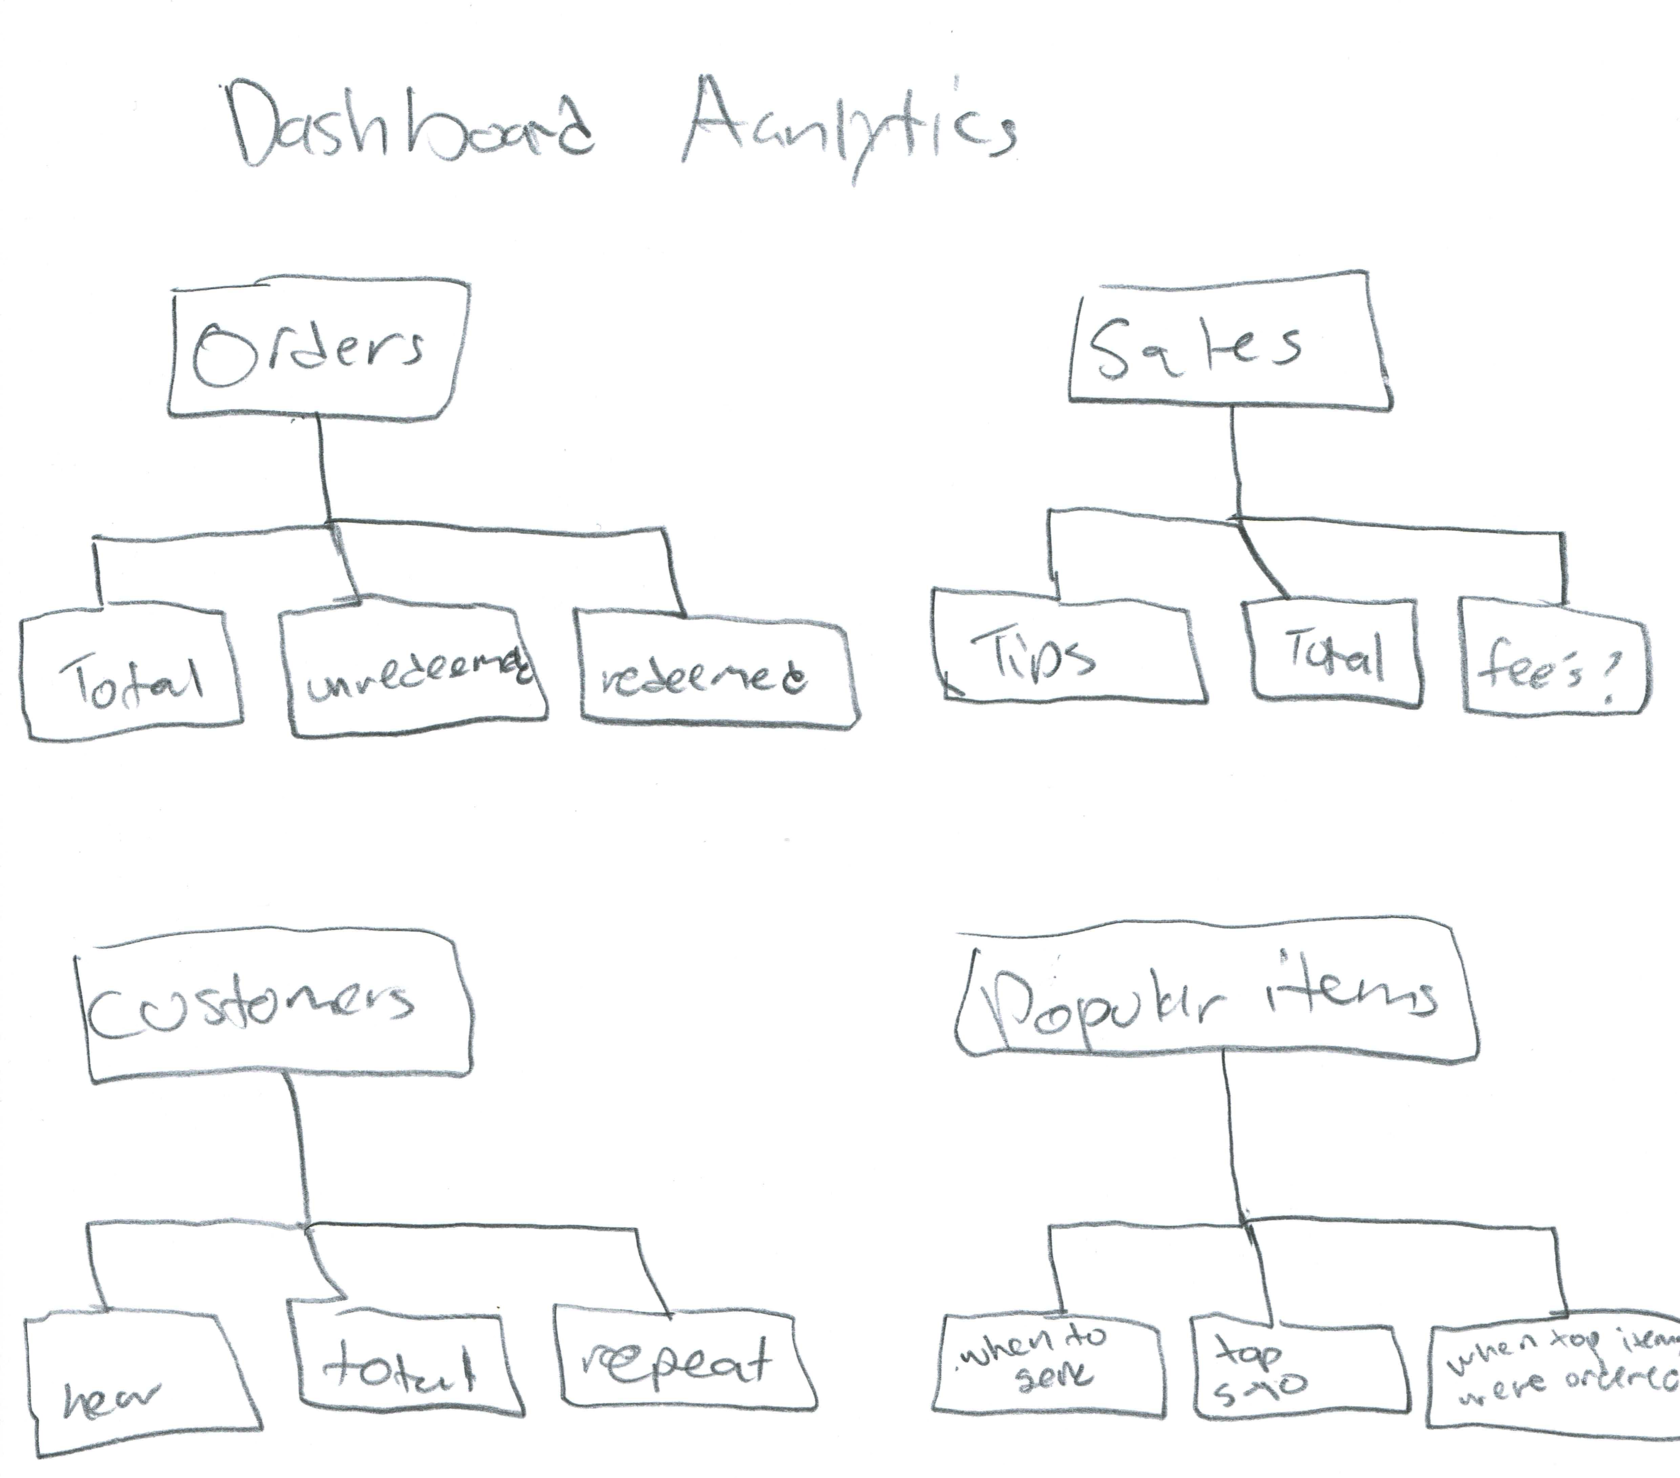
Before any visual design, the flows were mapped out to establish what belonged on the main dashboard versus deeper, merchant-specific screens — and how an admin's view into a merchant's metrics should relate to the merchant's own view of their business.
Sketches and Hi-Fi Mockups
The existing product already had a general layout of what mattered most, so a flow chart of that structure came first — a way to visualize what information the new version actually needed, before touching color or type.
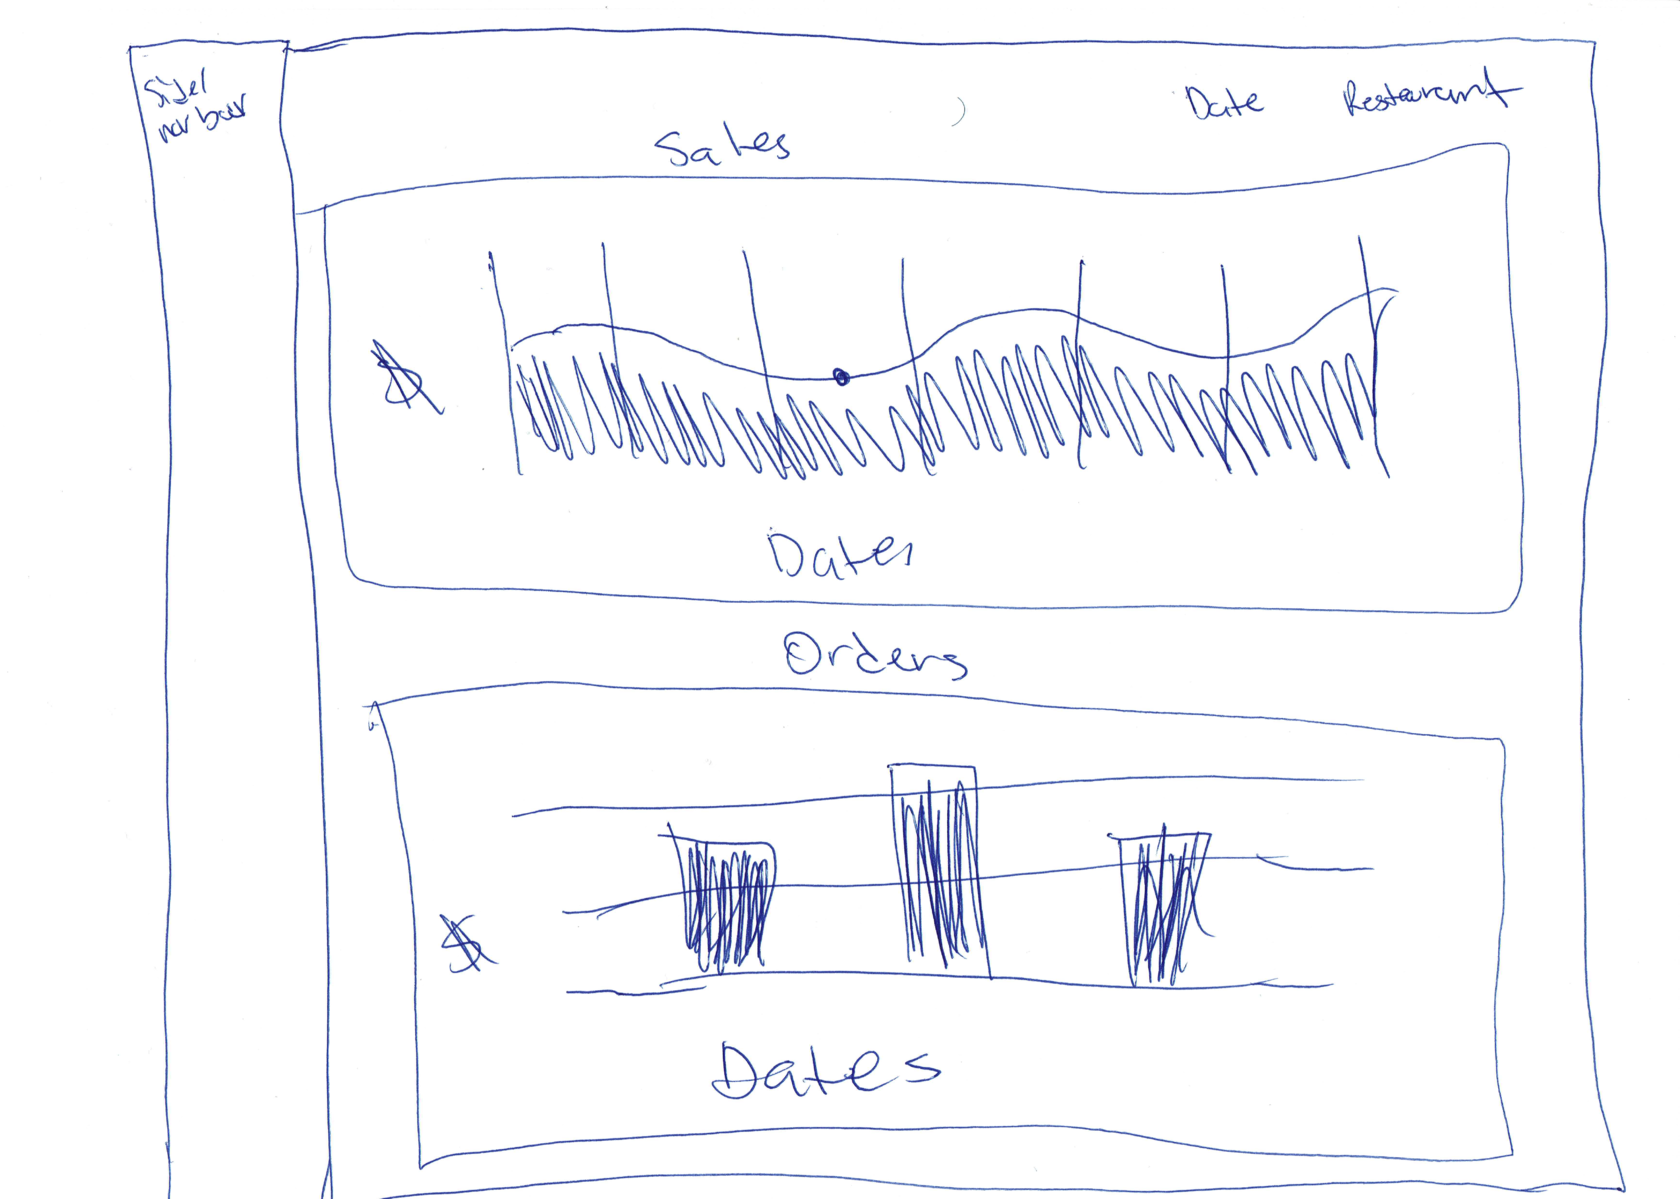
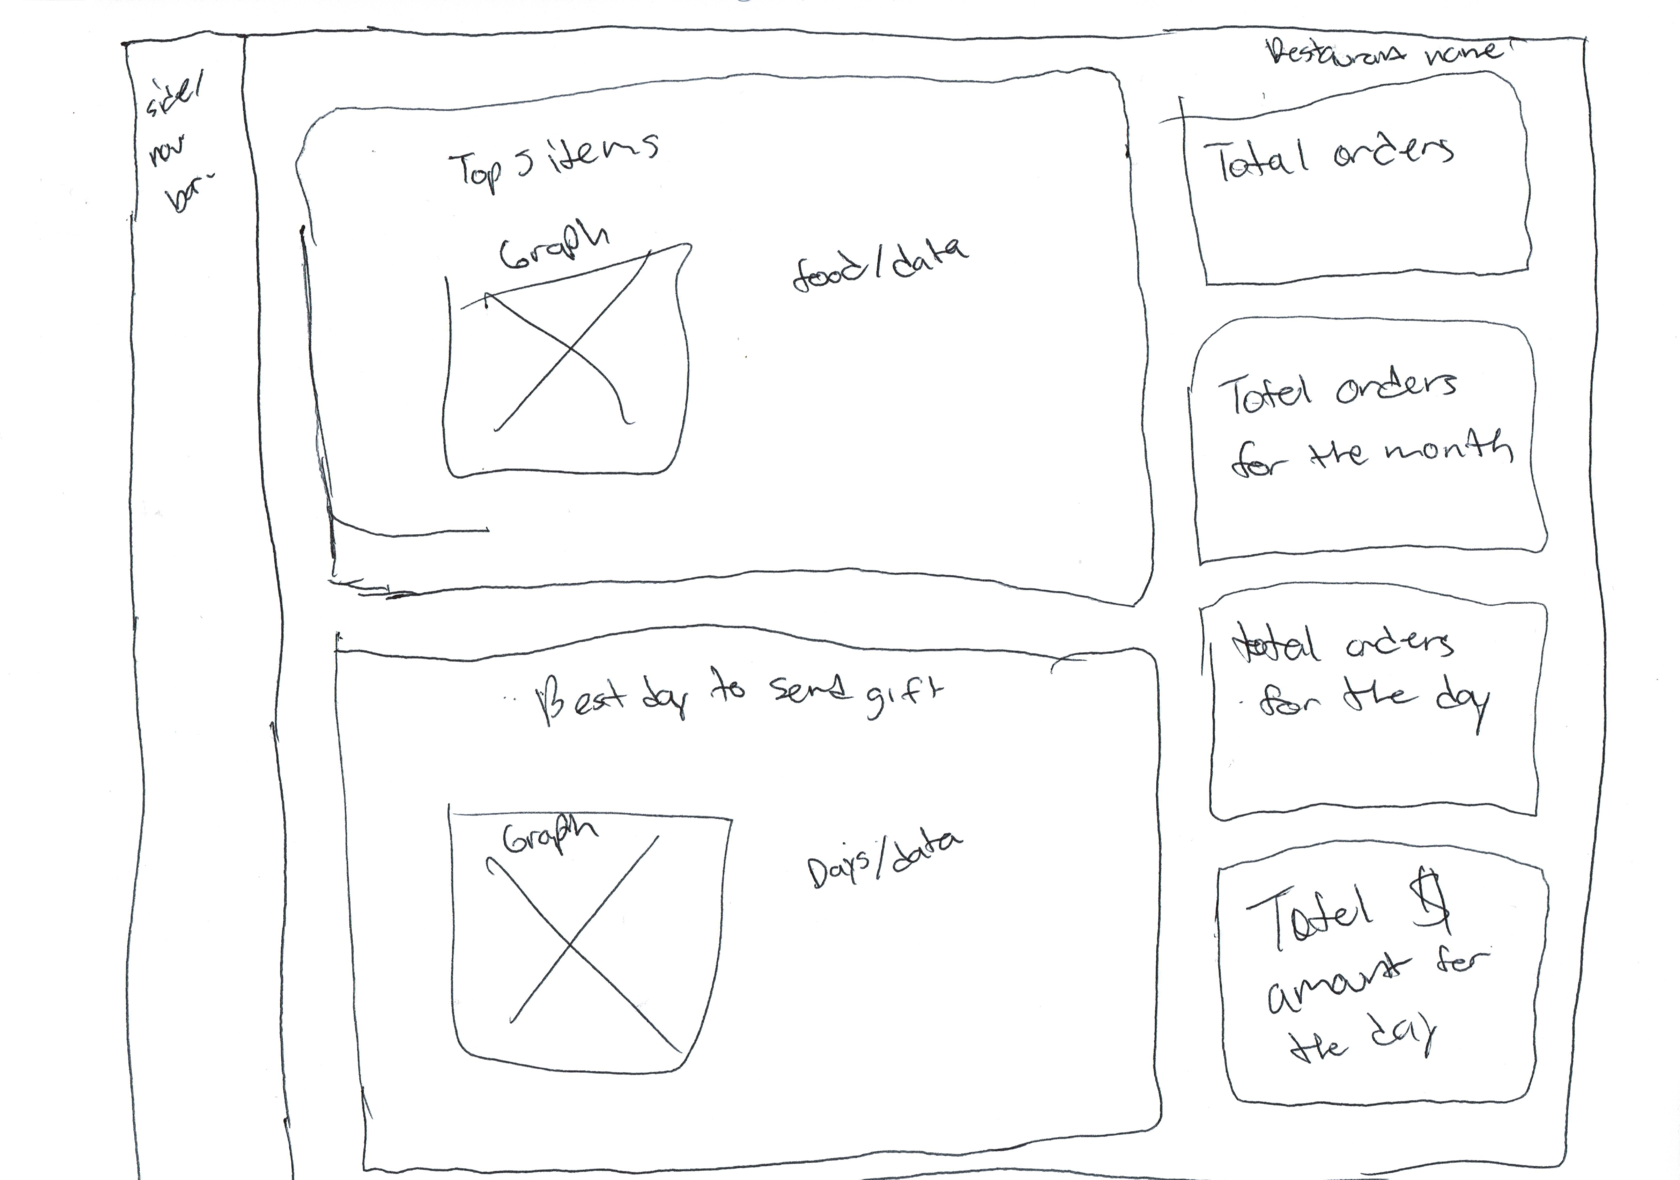
Very basic, on purpose
These were kept deliberately simple — something to fall back on in case anything more elaborate didn't work out. One sketch for the merchant-facing dashboard, one for the admin-facing merchant view.
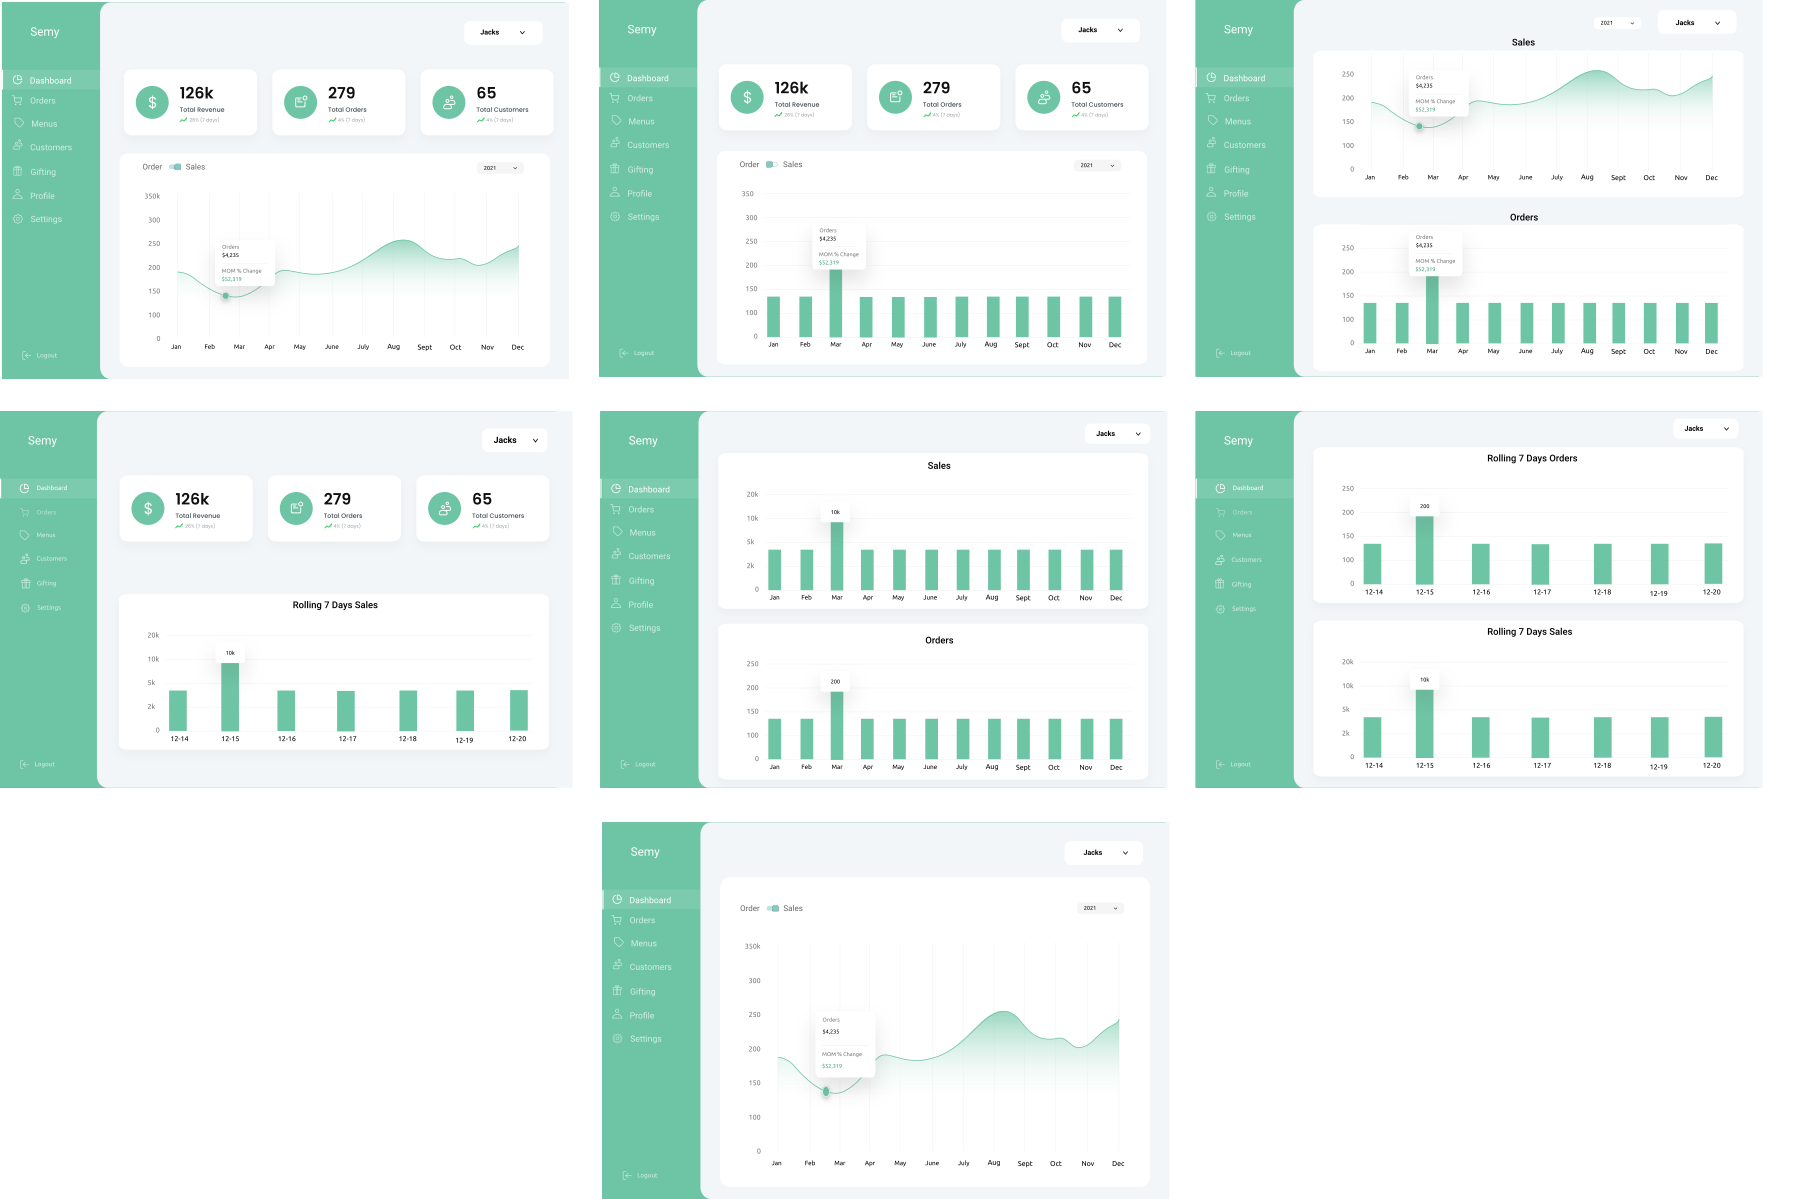
Simple versions, several ways
From left to right these are essentially the same screen, just with small differences in how the data is displayed. Clicking each metric card would take the user to a different page — for example, Total Orders would lead to the orders page, and the same click-through applied to the charts.
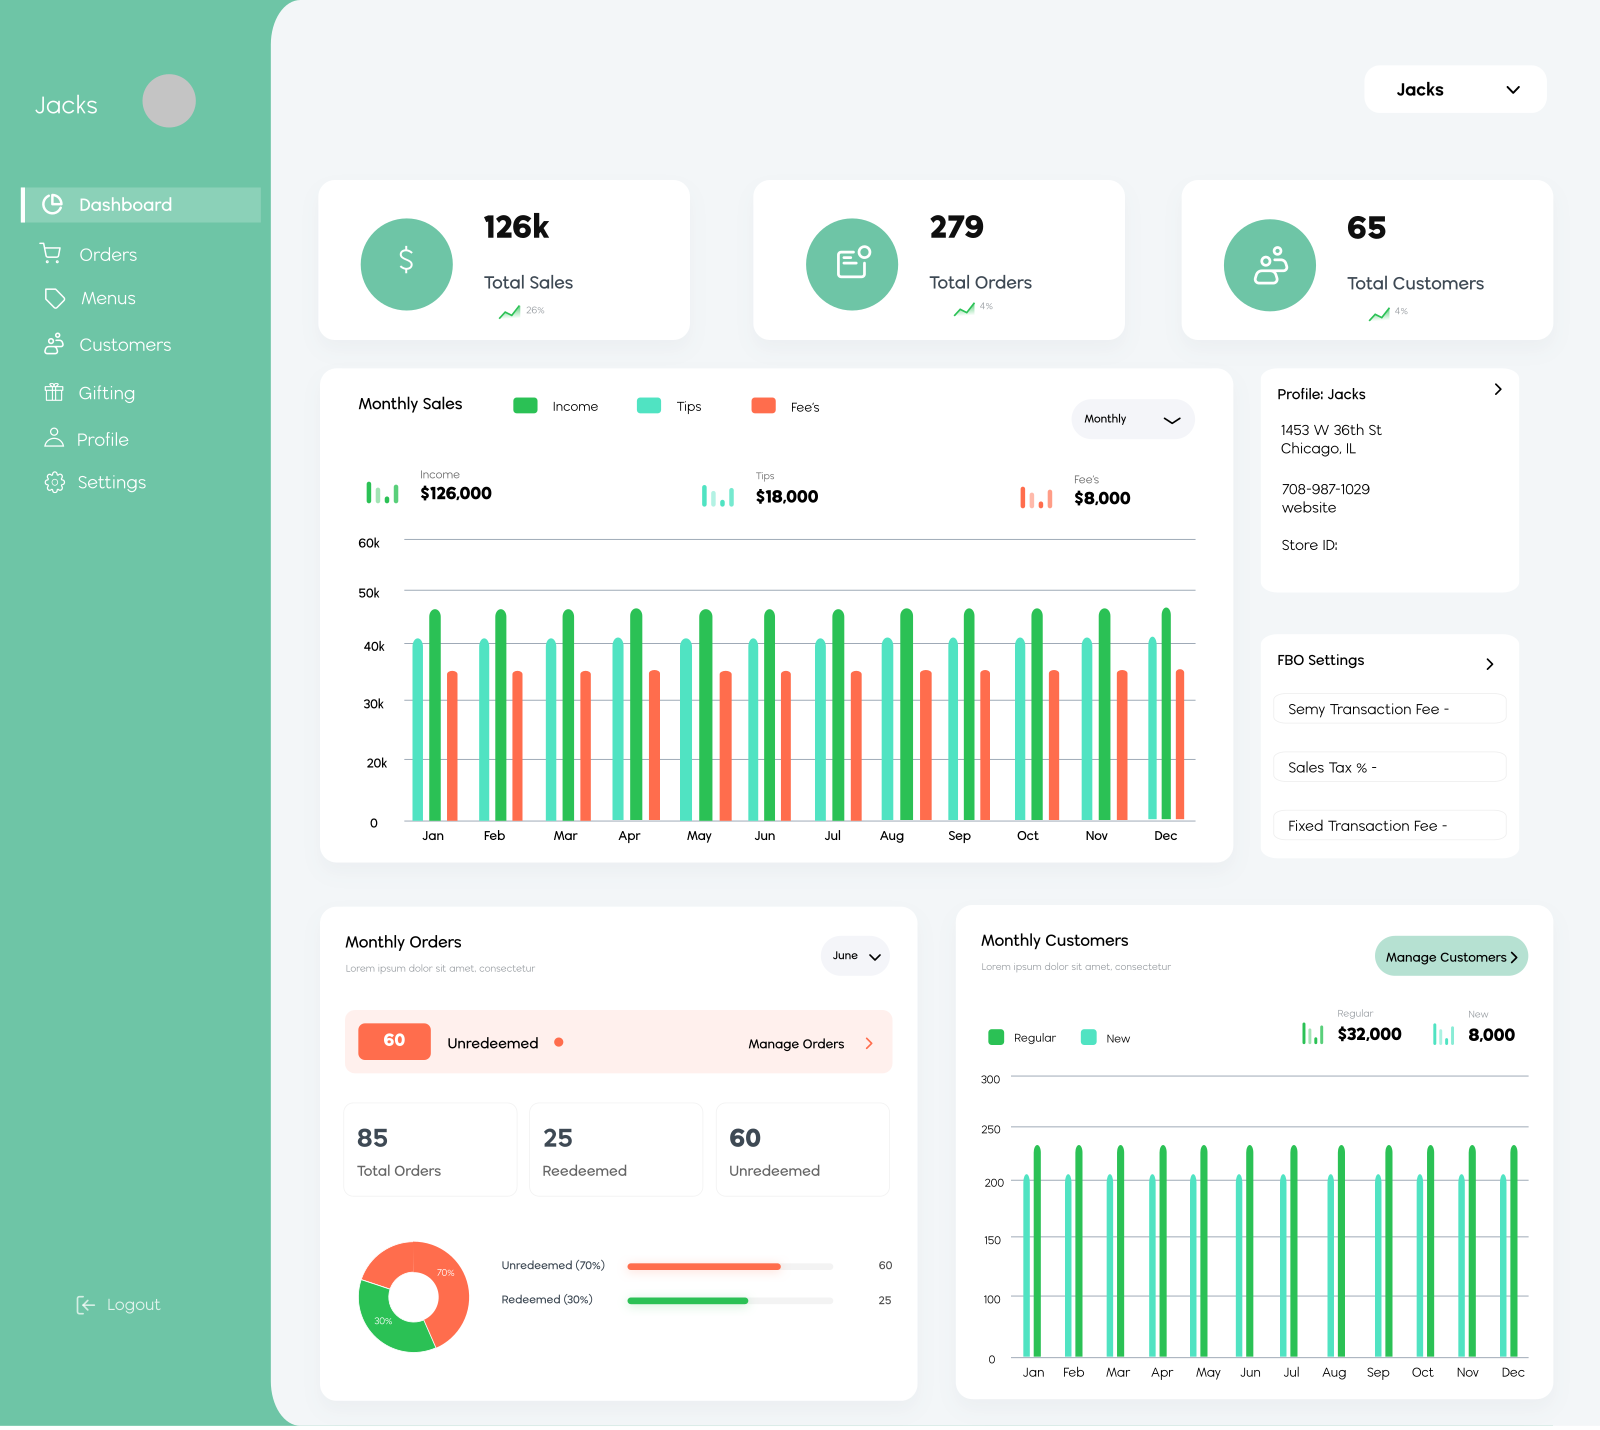
Final branded screens
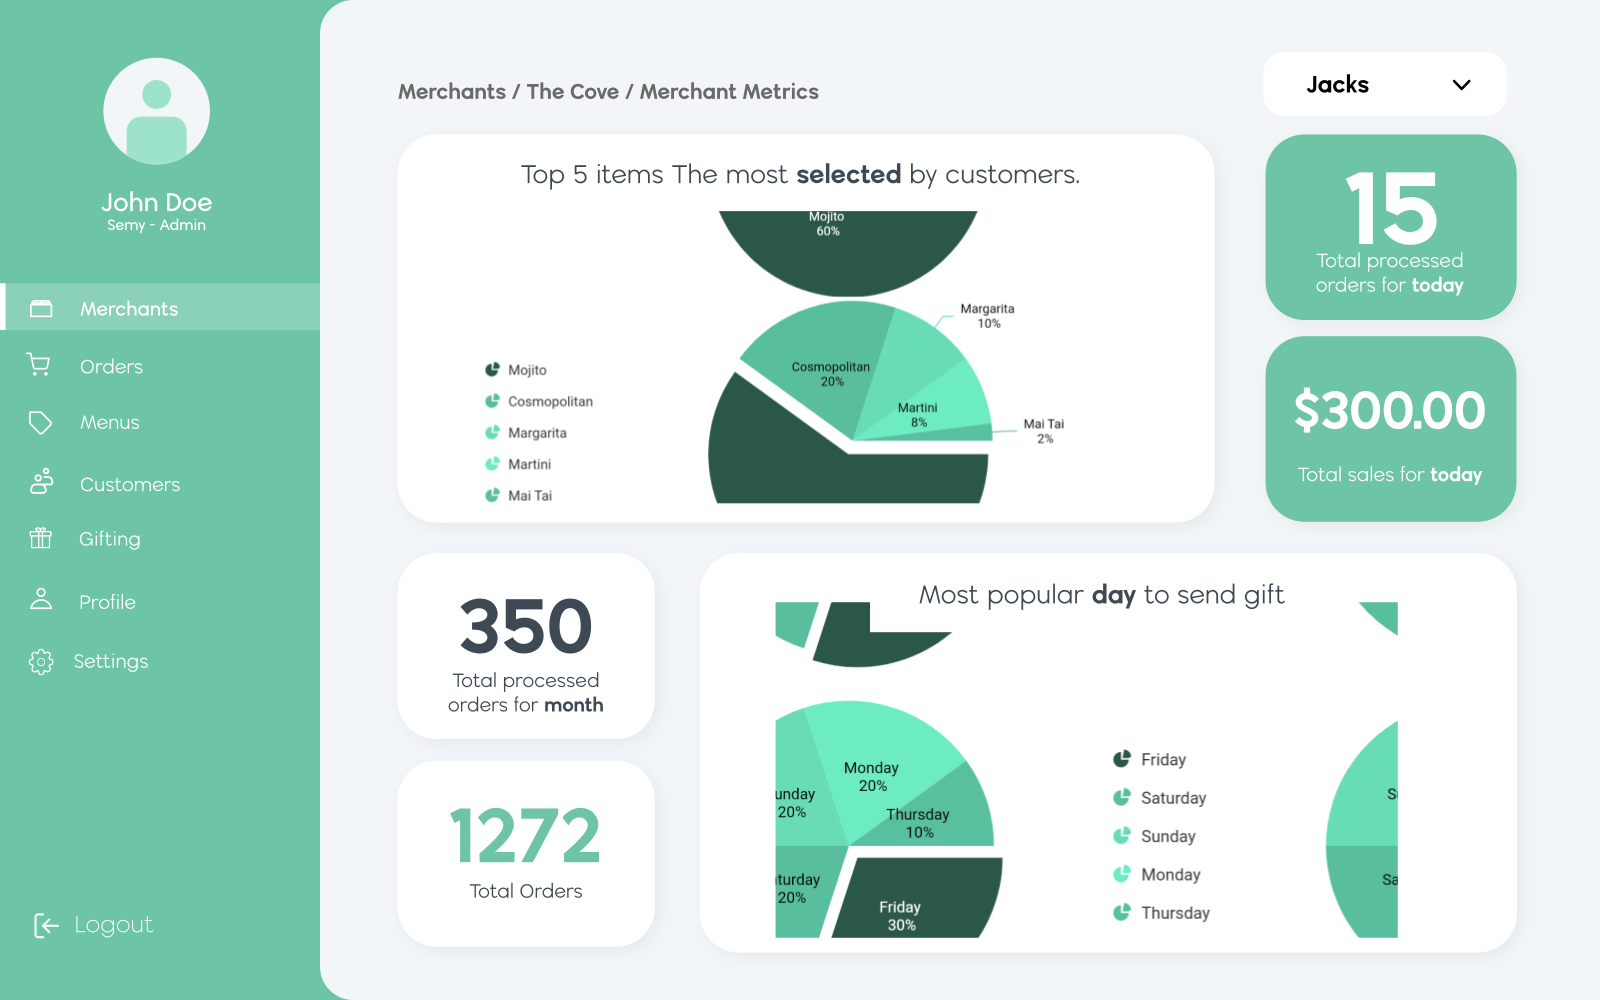
Still more detailed than the versions above, but landing in the middle rather than overloading the screen. The left version shows each card's detail expanded below it, including company info. The right version leans into orders and item popularity, and carries the updated brand typography that came out of a brand-guidelines refresh.
Conclusion
Starting small and building up turned out to be the easier path — the goal was to put something out immediately, then let the company grow into it. Keeping multiple versions and foundations around also makes it easier to adapt the product to different industries later, beyond food & beverage.
This part of the client account has been, and continues to be, a mix of build → test → release and build → prototype → release → test → get feedback. Three designs from this process have either shipped already or are still being considered for the next version.